Most Shopify Apps Have Never Been Rated. Here's How to Read the Ones That Have.
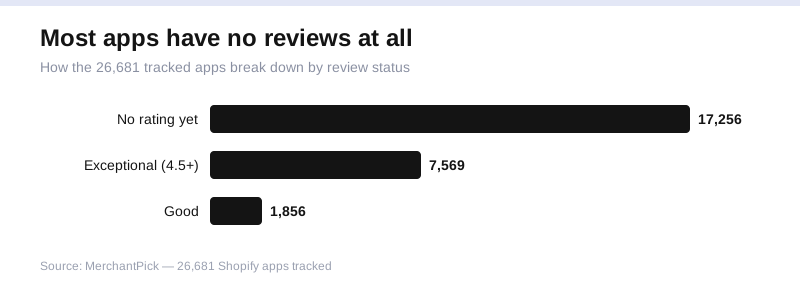
Start with the number that should bother you: of the 26,681 Shopify apps in our catalog, 17,256 have no rating at all. That is roughly 65 percent. Nearly two out of every three apps a merchant can install today have zero public verdict attached to them.
That fact reframes the whole exercise. Most advice about picking apps assumes you are choosing between a 4.7 and a 4.4, weighing reviews like a shopper reading Amazon. The reality is that most of the shelf has no reviews to weigh. And the part that does carry ratings is bent so far upward that the average has stopped meaning what you think it means.
I spend a lot of time inside this data, and I have come to treat the headline star number as one of the least useful things on an app listing. Here is why, and what I read instead.
The 65% that nobody has judged yet
17,256 unrated apps is not a rounding error. It is the defining feature of the Shopify app ecosystem, and almost nobody talks about it.
Think about what an unrated app actually is. It has been published, it works well enough to stay listed, and somewhere between zero and a few dozen merchants have installed it without leaving a review. That covers a huge range: a brand-new tool from a serious developer, a dead project the founder abandoned, a niche utility that does one thing for one type of store, and a quietly competent app whose users simply never bothered to rate it. All four look identical from the outside. All four show you nothing.
So the first move, before you compare stars, is to notice which bucket an app is in. If it sits in that 65 percent, the rating tells you nothing because there is no rating. You are back to reading the actual listing, the changelog, the support responsiveness, and whether the developer answers email. The absence of a score is information too, and merchants routinely misread it as neutral when it is closer to unknown.
Where ratings exist, they almost all point one direction
Now look at the 9,425 apps that do carry a rating. You would expect a spread: some great, plenty mediocre, a long tail of bad ones. That is not what the data shows.
Roughly 7,569 of them sit in the exceptional band, 4.5 stars and up. Only about 1,856 land in the merely good range. The count that rate poorly is tiny. So among rated apps, something like four out of five are branded exceptional, and almost none are branded bad.
Read that honestly. It is not evidence that 80 percent of Shopify apps are outstanding. It is rating inflation, the same compression you see on ride-share ratings and freelancer platforms, where anything below near-perfect reads as a failure and the middle of the scale quietly disappears. When 7,569 apps crowd into the top band and only 1,856 sit a notch below, the top band stops being a distinction. Almost everyone is in it. A 4.6 does not put an app ahead of the pack, because the pack lives at 4.6.
The merchants who get burned are the ones treating that 4.7 as a hard-won achievement. It usually is not. It is the resting position of the whole rated population.
Why the average lies on small samples
The star number has a second problem that inflation hides: most averages are built on almost nothing.
A 5.0 from eleven reviews and a 4.8 from three thousand are printed in the same font, at the same size, with the same gold stars. They are not remotely the same claim. The first is a handful of early adopters, quite possibly nudged by a founder who asked happy users to leave a review during onboarding. The second has survived thousands of merchants across years, versions, pricing changes, and Shopify platform updates. Only one of those has been stress-tested.
On a small sample, the average is mostly noise. Three reviews cannot tell you how the app behaves at scale, how support responds when something breaks at midnight, or whether it still works after the next theme update. A perfect score from a dozen people is a perfect score from a dozen people. Treat it as a rounding artifact, not a verdict. Given that the whole rated population already clusters near the top, a thin five-star listing is the single easiest signal to fake and the single easiest one to overrate.
Read the shape, not the number
If the average is weak, what is strong? The distribution. The shape of the reviews tells you far more than their mean.
Open the breakdown and look at the low end first. An app with a genuine cluster of one- and two-star reviews is often more useful to you than a spotless one, because those reviews name the actual failure modes: billing that keeps charging after uninstall, support that goes silent, a feature that breaks on a specific theme. That is your risk list, written by people who already hit the wall.
Then weigh volume against the pattern. A 4.4 across two thousand reviews with a small, consistent complaint about one edge case is a known quantity. A 4.9 across forty reviews is a guess. Between two apps that both sit in that 7,569-strong exceptional band, the tiebreaker is never the extra tenth of a star. It is which one has been rated by enough people, over enough time, to trust the shape.
Recency beats the lifetime average
Ratings accumulate, but code changes. An app can hold a beautiful lifetime average that was earned two years ago by a version that no longer exists.
Developers get acquired. Founders lose interest. A pricing model flips from one-time to monthly. A rewrite ships and quietly breaks half the integrations. None of that shows up in the lifetime star average, which keeps floating on years of old goodwill. It shows up in the last few months of reviews, if you go read them.
So sort by recent and read forward. A steady 4.5 where the newest reviews still sound like the oldest is a healthy app. A 4.8 lifetime average whose last dozen reviews are furious about a broken update is an app in decline wearing an old medal. Recency is where you catch the decline before it becomes your outage. This matters even more given the inflation: when everything sits near the top, a fresh run of angry reviews is one of the few signals sharp enough to actually separate apps.
The number is the start, not the answer
The star rating on a Shopify app listing is a compressed, inflated, often thinly sourced summary, and 17,256 of the 26,681 apps we track do not even have one. Read it as a starting filter and nothing more.
The merchants who choose well are not the ones who found the highest average. In a rated population where 7,569 apps already sit at the top, everyone found a high average. They are the ones who read the shape, weighed the volume, checked the recent reviews, and treated the badge with the skepticism it earns. Do that, and you are already ahead of most of the people installing apps this week.


